Our organization is our people
Increasing our organization’s diversity, equity, and inclusion (DEI) is a key material topic.
As stated in our Group’s Code of Ethics: “The Group opposes all discriminatory behaviours and those intended to harm people, their beliefs and tendencies, with reference in particular to physical and mental disabilities and impairments or different forms of diversity based on their culture, religion or sexuality. The Group implements appropriate measures in the selection, hiring and internal development phases to guarantee all the people of Lamberti a fair treatment based on criteria of merit and with no discrimination whatsoever. Specifically, the Group promotes terms and conditions of staff employment which do not discriminate between people for reasons of race, ethnic origin, nationality or religion and strives to provide a workplace free from harassment. This not only includes sexual harassment but also harassment based on any one of the characteristics listed above.”
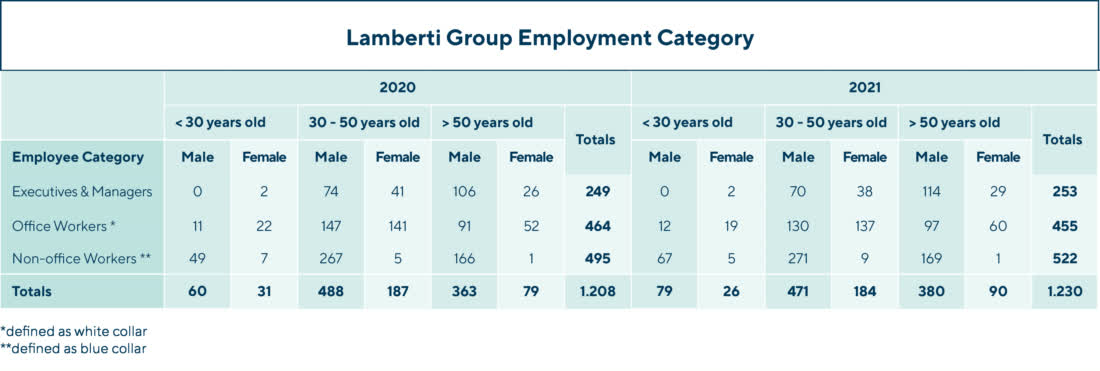
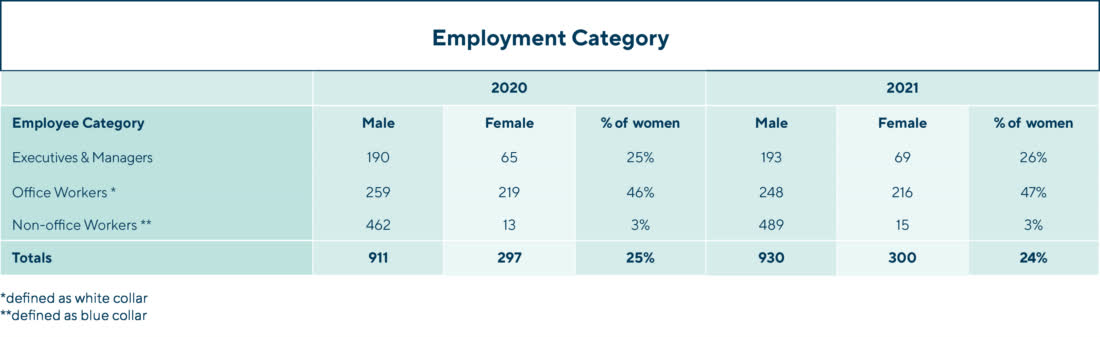
Our employee population consists of 24.87% women, which occupy 5.48% of all executive and managerial positions at Group level. The office workers category consists of 18.02% women.